Economic & Market Overview – April 2018
Global
The Trump administration’s move to impose tariffs on the import of various goods from China cannot yet be described as a trade war, but the first punches in this scuffle has certainly introduced additional volatility in global markets. For now, real sector data aligns broadly with stable global growth for 2018. The outlook for 2019 is less assured, as concerns of overheating in the United States continue to weigh on consensus forecasts and speculation mounts of a full-blown stand-off between Donald Trump and Xi Jinping.
Apparent spare capacity in the Eurozone and Japan’s labour markets should continue to dampen the pickup in inflation in these regions. In contrast, a continued rise in core PCE alongside increasing wage growth could allow US headline CPI to breach 2%. After hiking interest rates by 0.25% in March, the Fed is now faced with the challenge of balancing its somewhat optimistic view of the economy against market expectations. The market is increasingly leaning towards four hikes according to the Fed fund futures, though much depends on how quickly wage and price inflation materialise. The European Central Bank continues to favour gradual policy normalisation. Although members of the Governing Council hold somewhat divergent views on when to cease asset purchases, they appear more confident in their outlook for inflation, alluding to hikes sometime in 2019. For now, the economic backdrop and particularly the spare capacity in the Eurozone’s labour market, does not suggest immediate policy tightening.
According to John Stopford of Investec Asset Management most of the expected interest rate increases are priced into the US Dollar against the Euro, so investors should not expect a strengthening of the greenback on the back of interest rate increases alone. He added that the recent correction in global equity markets, coupled with better than expected corporate earnings, has improved the valuation of large parts of the market.
South Africa
Moody’s confirmed South Africa’s investment grade credit rating at Baa3. In a market overview from Granate Asset Management they report that, in explaining its decision, Moody’s points to the prospects of a gradual reversal of the previous deterioration of SA’s institutions; improved growth performance and prospects; and the 2018 Budget that would stabilise and eventually reduce the debt burden.
The market was particularly encouraged by Moody’s surprise decision to change the rating outlook from negative to stable reflecting “…a careful balance of risks. The new administration faces equally significant opportunities and challenges”.
The Monetary Policy Committee of the South African Reserve Bank met towards the end of the month and decided to cut the repo rate by 0.25% basis points to 6.5%. The rate cut was a close call (3 of the 7 members voted to keep it unchanged) and was accompanied by a hawkish statement which suggests that this might be the last rate cut this year.
With global growth and commodity prices continuing to support local growth, RMB Global Markets expect the decline in political and policy uncertainty – the key reasons for sub-optimal growth in the past five years – to lead to higher investment and economic growth. They revised their economic growth forecasts upwards to 1.7% (2018) and 1.9% (2019). An increase in private consumption is likely to support growth in 2018. Relative to last year the rand is stronger and both inflation and interest rates are lower.
Much of the good news in the local economy and political environment seems to be accounted for in equity market valuations which are still elevated. Any change to this relatively rosy picture could lead to a continuation of the rather bumpy start that investors have experienced in the first quarter of 2018.
Market performance
In March 2002 Naspers traded around R12 per share, and over the next 15 years grew to R3 845 on 17 November 2017. Over the last few years this company, which has by some margin the largest market capitalization on the JSE, has contributed to around half the growth of the total bourse. It was therefore no surprise to see the JSE All Share Index pull back by over 4% in March as Naspers shed a little over 11% during the month. From the share’s high in November 2017 it has retracted by nearly 22%. Interestingly enough the total return of the JSE ALSI is about flat during the same time, which illustrates just how well locally focused companies (financials and retailers in particular) have done as the political sentiment turned positive ahead of, and certainly after, the ANC elective conference in December.
The three months from the start of 2018 has been a rocky ride for South African investors and led to a decline of 6% in local equities. Property securities in particular weighed on market returns as the broad index ended the quarter nearly 20% lower. Much of this was driven by the performance of Resilient and its related companies which more than halved during this time. The bond markets performed well in the light of an improved outlook from Moody’s as well as lower interest rates and ended the quarter 8% higher.
Global equities came under pressure in March as a result of uncertainty surrounding the impact of trade wars and US protectionist policies on the large, multi-national tech companies. It led to a decline of a little over 5% for the quarter when measured in Rand terms. Growth assets (equity and property) underperformed defensive assets (bonds and property) since the start of the year, but over the year ending 31 March local and emerging market equities still outperformed cash, with bonds leading the ranking tables as the All Bond Index (ALBI) added over 16% for the year.
The vast difference in investment returns of the different asset classes, both over the last quarter as well as the last year, illustrates the value of well diversified multi-asset portfolios that provides a relatively smoother ride through turbulent markets.
| Market Indices | 31 March 2018 | |
| (All returns in Rand) | 3 months | 12 months |
| SA Equities (JSE All Share Index) | -6.0% | 9.6% |
| SA Property (SAPY) | -19.6% | -7.1% |
| SA Bonds (SA All Bond Index) | 8.1% | 16.2% |
| SA cash (STeFI) | 1.8% | 7.4% |
| Global Developed Equities (MSCI World Index) | -5.5% | 0.9% |
| Emerging Market Equities (MSCI Emerging Market Index) | -3.0% | 10.6% |
| Global Bonds (Barclays Global Aggregate) | -3.0% | -5.5% |
| Rand/Dollar | -4.3% | -11.6% |
| Rand/Sterling | -0.8% | -0.9% |
| Rand/Euro | -2.0% | 1.6% |
| Average South African Multi-Asset High Equity fund | -3.6% | 3.3% |
| Average South African Multi-Asset Low Equity fund | -1.3% | 4.7% |
Commentary: Cash is king – or perhaps not?
During times of market turmoil investors often compare short term portfolio returns to cash, and then argue that cash is king. The last year would be a great example: balanced funds typically returned between 1% and 7% to investors (depending on their asset allocation among other factors) with cash earning nearly seven and a half percent. Hindsight would dictate that a move to cash at the end of March 2017 would have resulted in a slightly better outcome for investors over the historical 12-month period.
While this might have been true for the quarter and one year under review, it’s not as clear cut a decision when considering the next quarter or year. A drastic move from asset classes exposed to long term growth opportunities (and therefore risk) may work over very specific periods, but that’s not the only consideration for investors. The second leg of such a move is of course when to return to asset classes that protect investors from the diminishing effect that inflation has on the purchasing power of their capital. While cash may beat inflation on the face of it, investors need to remember that tax gobbles up a large portion of the interest earned on cash and that on a net of tax basis a long-term allocation to this very safe asset class means a guaranteed loss of purchasing power.
If timing the market (successfully moving between “risky” assets and cash) is so tricky, what can investors do to enhance the probability of reaching their investment goals? The secret here is “time in the markets” as opposed to “timing the market”. Old Mutual Investment Group’s Macro Asset Solutions team recently published the very long-term performance of three local asset classes: equities, bonds, and cash. In a data series stretching over 88 years they showed the clear need for equities (as a proxy for growth assets) in portfolios that aim to protect the purchasing power of an investor’s capital:
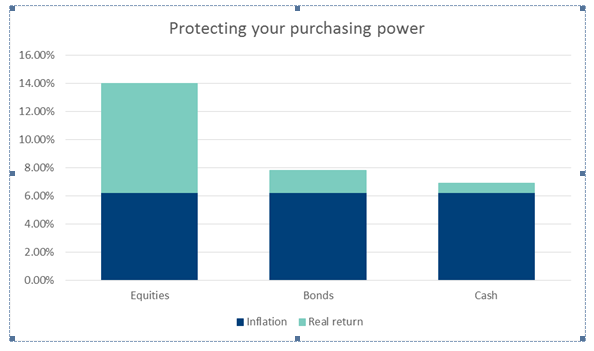
Achieving these long-term returns means that investors would have to endure periods such as the last quarter or the last year in order to reach their goals at the end of the horizon. In a conservative multi-asset fund an annual return of 4.7% (the average return of such funds over the last year) is just as likely as earning 11.2% over a 12-month period if the history over the last 20 years is anything to go by. It’s the longer term expected return of around 8% (or 2.5% ahead of inflation) that should be relevant to investors. Who would turn out to be the successful investors during times like these? Those who understand that a lot of irrationality drives markets over the short term, but rationality becomes clear over longer time periods. Often sitting on your hands when you are itching to take drastic action is what trumps a tinkering with your investment strategy for the mere sake of doing something.
In conclusion it may be useful to learn from one of the most successful investors over the last century. It was in a discussion in 2014 between the ex-Governor of the Federal Reserve and Warren Buffett that Alan Greenspan uttered this profound statement:
“Warren, it strikes me that if you did nothing else you never sell. That is, if you can grit your teeth through and just disregard short-term declines in the market or even long-term declines in the market, you will come out well. I mean you just stick all your money in stocks and go home and don’t look at your portfolio you’ll do far better than if you try to trade it.”
Source : APS Monthly Commentary