Economic & Market Overview – November 2018
Global
Despite what may be suggested by the turmoil in investment markets, not much has happened to slow down the synchronised global recovery that we’ve seen through most of 2017 and 2018. The United States (US), in particular, keeps on producing solid economic growth.
According to Torsten Slok (Chief International Economist of Deutsche Bank), there is a narrative in markets which compete with this view and has very different investment implications. The first view is that economic growth is strong and earnings are good, and the consensus expects this to continue as the tailwind from President Trump’s corporate tax cut lasts. The investment implications of 3% economic growth is that US interest rates will move higher and equities will perform well. The conflicting view in markets is the idea that global quantitative easing (QE) is coming to an end and the US is issuing a lot more Treasuries which, taken together, means less demand for global fixed income and far more supply of risk-free assets. Overall, this means decreased appetite among investors for buying risky assets. The investment implications of this is still higher interest rates, but lower returns from equities as global capital flows back to safe haven assets. The bottom line is that Deutsche Bank expects heightened volatility (as we’ve seen during the last couple of months), gradually increasing rates and further upside in US equities. In sum, the “strong economy” narrative still dominates the “liquidity withdrawal” narrative. Consequently, the risk to the economic narrative is not a recession, but instead overheating and an associated overshoot in inflation.
Looking at the rest of the developed world, there are indicators that point towards a slowdown in global growth in 2019 as the impact of fiscal stimulus in the US fades and the cumulative effect of monetary policy tightening bites. Moreover, China is expected to underperform despite recent stimulus measures as credit growth remains depressed. The share of goods impacted by tariff increases remains a negligible portion of total world trade, so it’s certainly not as big a concern as many news reports imply.
2019 takes us into the 10th year past the global financial crisis and will provide investors with both risk and opportunity. The former should be managed while investors prepare to make the most of the latter.
South Africa
It has been a turbulent year for SA financial assets, starting with a euphoric rally after President Ramaphosa’s victory in December 2017, and then giving back earlier gains as investors’ patience waned halfway through the year.
Implications for SA investors from a recent report published by MRB Partners (South Africa: Circles or Spirals?) can be summarised by these three points:
- President Ramaphosa’s administration is hamstrung in the face of next summer’s election, and no SA rally can be sustained without clarity about economic policy and/or structural reforms.
- Rising US Treasury yields will continue to be the dominant headwind for the rand and local-currency bonds, which are not yet cheap despite significantly underperforming this year.
- Local investors should stay positioned for rand weakness in a multi-asset portfolio, favouring stocks over bonds. Investors are unlikely to lose money on rand bonds in local currency terms, but rand hedge segments of the equity market and dual-listed stocks are much more appealing in the context of a weak currency.
MRB further states that President Ramaphosa may eventually succeed in squaring the many circles of SA politics, but surely not in an election year. Add to that anaemic economic growth (below 1%) and negative sentiment towards the region and investors could be excused for moving capital elsewhere. These negative trading conditions are already intrinsic in valuations and an upturn could boost investment markets.
Market performance
Global equity markets recorded their worst month in over six years as trade wars, Brexit, Italy’s debt, US interest rates, high equity valuations and profit taking (after US markets hit record highs earlier in the month) combined to raise concerns about the sustainability of one of the longest economic upcycles on record. SA equities followed suit as it gave up more than 17% from its highs in August as the FTSE/JSE All Share Index turned below 51 000 for the first time since June 2016. There was some respite for investors towards the end of the month as global and local equity markets bounced back sharply.
SA bonds were hit hard again (-1.7%) on a worse than expected Medium Term Budget Policy Statement (MTBPS) delivered by Finance Minister Tito Mboweni. The listed property sector recorded another negative month and, together with all other domestic asset classes, has now underperformed the money market over the last five years. Within local equities, industrial shares (-8.0%) had a particularly tough month with Naspers ending the month down 15%. Resources stocks ended the month down 4.0%, with the exception of gold stocks such as Sibanye Gold (up 19.5%), AngloGold Ashanti (up 16.7%) and Gold Fields (up 15.2%) which performed well in the risk-off environment. Financial stocks (-3.2%) also had a negative month. South African Multi-Asset High Equity Funds delivered an average of 8.4% to investors during the last 12 months with their low equity counterparts ending up 7.4%.
Commentary – Ulysses and the Sirens
Ulysses and the Sirens is a 1909 oil painting by Herbert James Draper. It depicts an episode in the epic poem, Odyssey, by Homer in which Ulysses (Odysseus) is tormented by the voices of Sirens. They sang an enchanting song that normally caused passing sailors to steer toward the rocks, only to hit them and sink. All of the sailors had their ears plugged up with beeswax, except for Ulysses, who was tied to the mast as he wanted to hear the song. He told his sailors not to untie him as it would only make him want to drown himself.
Forward to 2018 and not much has changed. Replace Ulysses with the astute investor, the sailors with his/her trusted advisors and the Sirens with news clips (or neighbours). Hitting the rocks in this instance would be changing your investment strategy during the storm. We’ve seen this movie before during the global financial crisis of 2007 to 2009, the bear market of 2002 and 2003 (following the 9/11 terrorist attacks in New York) and the Asian crisis of the late 90’s to name but a few. And every time the patient and disciplined investor came through with flying colours.
In our role as trusted advisor, it may be useful to explain why investors should not do anything drastic in times of market downturn. First of all, every bull market (up to the most recent one) has been followed by a bear market. So don’t act surprised – it happens. Secondly, bear markets are typically much shorter than bull markets. In the third instance, stick with your strategy.
If you had the discipline to only look at your portfolio on 31 December every year since 1995, you would have experienced negative performance in four calendar years: 1996, 1997, 2002, and 2008. Under the assumption that you had at least a three-year time horizon and the discipline to remain invested, you would have enjoyed the following outcomes (returns in excess of a year are not annualised):
| Calendar year | FTSE/JSE ALSI (total return) | Return in subsequent two years | Total return over three years |
| 1996 | -7% | 61% | 50% |
| 1997 | -6% | 71% | 61% |
| 2002 | -8% | 46% | 34% |
| 2008 | -23% | 57% | 21% |
The danger, of course, is that a nervous investor changes tack at exactly the wrong point. Moving to cash (from growth assets such as equities) at the end of any of these four years would have been disastrous if you consider the stellar performance of the two years that followed.
So where are markets compared to their history? We’ve analysed the five-year rolling performance of equities and balanced funds since 1994 and compared it to the five-year rolling inflation rate over the same period. The graph below shows that balanced funds and SA equities has only underperformed inflation (over rolling five years) twice since 1994 (and has come pretty close in October 2018):
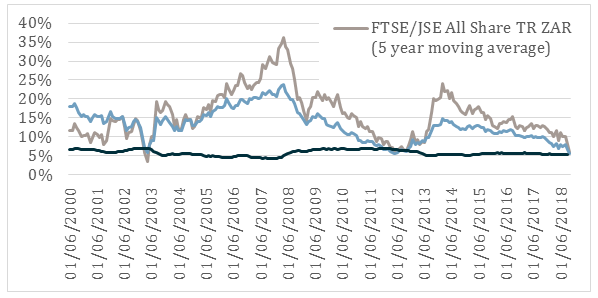
It’s important to notice how quickly the returns over five years picked up from these lows. The seasoned (or well-advised) investor will know that now is the time to sit on your hands and ignore the sweet voices of the Sirens luring you to the rocks.
Another way to view the current state of affairs is to consider where current equity market returns over various rolling periods are. The chart below shows the current one-, two-, three-, four-, five-, seven- and 10-year annualised performance of local equities against its own history over the same rolling periods:
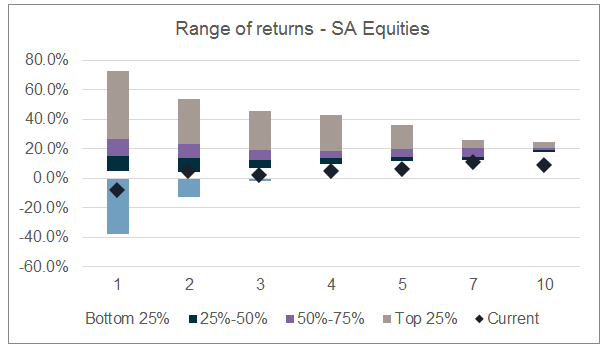
It’s not quite as bad as it’s been before, except for over ten years where this is pretty much the lowest return over any rolling ten-year period since 1994. Can markets go any lower? Possibly. Are they more likely to surprise on the upside from this point on? Quite likely, if historical trends are anything to go by. So buckle up, take good advice, and enjoy the ride. It’s what Ulysses would urge you to do.
Our offices will be closed from the 22nd of December and will re-open on the 3rd of January 2019 and monthly statements will only be issued at the end of January 2019.
The Boards of Directors of Pentagon Financial Solutions and Associated Portfolio Solutions would like to take the opportunity to wish all our clients a blessed festive season and a prosperous 2019. Please be assured that we shall continue to manage your investments with due care and responsibility.
God Bless.